


 59 / 72

ImplanTec, Mödling, Austria), which consist of titanium bands and
stabilizers. The stabilizers were locked to the sawbones by little spikes
along the edges and firmly attached by compression bands according
to the manufacturer
’
s recommendations. Two stabilizers and four
cerclages were used for each sawbone construct (Figure 3a
–
d).
Test setup
The biomechanical test was performed on a servo-hydraulic testing
machine (Instron 8874, Instron Ltd., High Wycombe, United Kingdom,
Figure 4). Distally, the embedded bone implant construct was rigidly
fixed to the machine frame with an angle of six degrees between the
femur shaft and the machine axis in the lateral direction. This was
achieved by rotating the vice in the frontal plane to simulate an axial
load along the mechanical axis of the leg (Mikulicz-line). Proximally,
the force application at the femoral head was performed through
an artificial acetabular cup which was embedded in an aluminum
cylinder. The cylinder was connected to the actuator of the testing
machine, including a biaxial load cell (Instron Dynacell, measuring
range ±10 kN, ±100 Nm, Instron Ltd., High Wycombe, United
Kingdom). To avoid undesirable constraint forces, movements of the
test samples in the transversal plane were allowed due to the use of a
cross table, attached to the load cell and the aluminum cylinder. To
record the movement of the fragments, markers were fixed to the
proximal and distal bone fragments. An additional reference marker
was installed for software orientation.
Test procedure
The samples underwent a cyclic testing protocol with an increasing
axial load level and testing was performed until failure. In a first step,
the specimens were preconditioned for 100 cycles at a sinusoidal cyclic
load between 50 and 500 N and a frequency of 2 Hz to allow for the
samples to settle. Then, three quasi-static ramps were performed
stroke controlled with a ratio of 0.02 mm/s to stress the specimens
up to 500 N for the determination of initial axial construct stiffness.
Stiffness was determined from the linear portion of the load-
deformation curve. After that, the constructs resumed fatigue loading
by first ramping the 500 N lower level set point. Cyclic sinusoidal
fatigue loading then followed with an initial 2000 N upper load,
increasing the upper load by 150 N every 500 cycles until failure.
Failure of the periprosthetic fracture construct was defined as breakage
of the bone, breakage of the plate or the cerclage systemor 30 mm axial
actuator displacement.
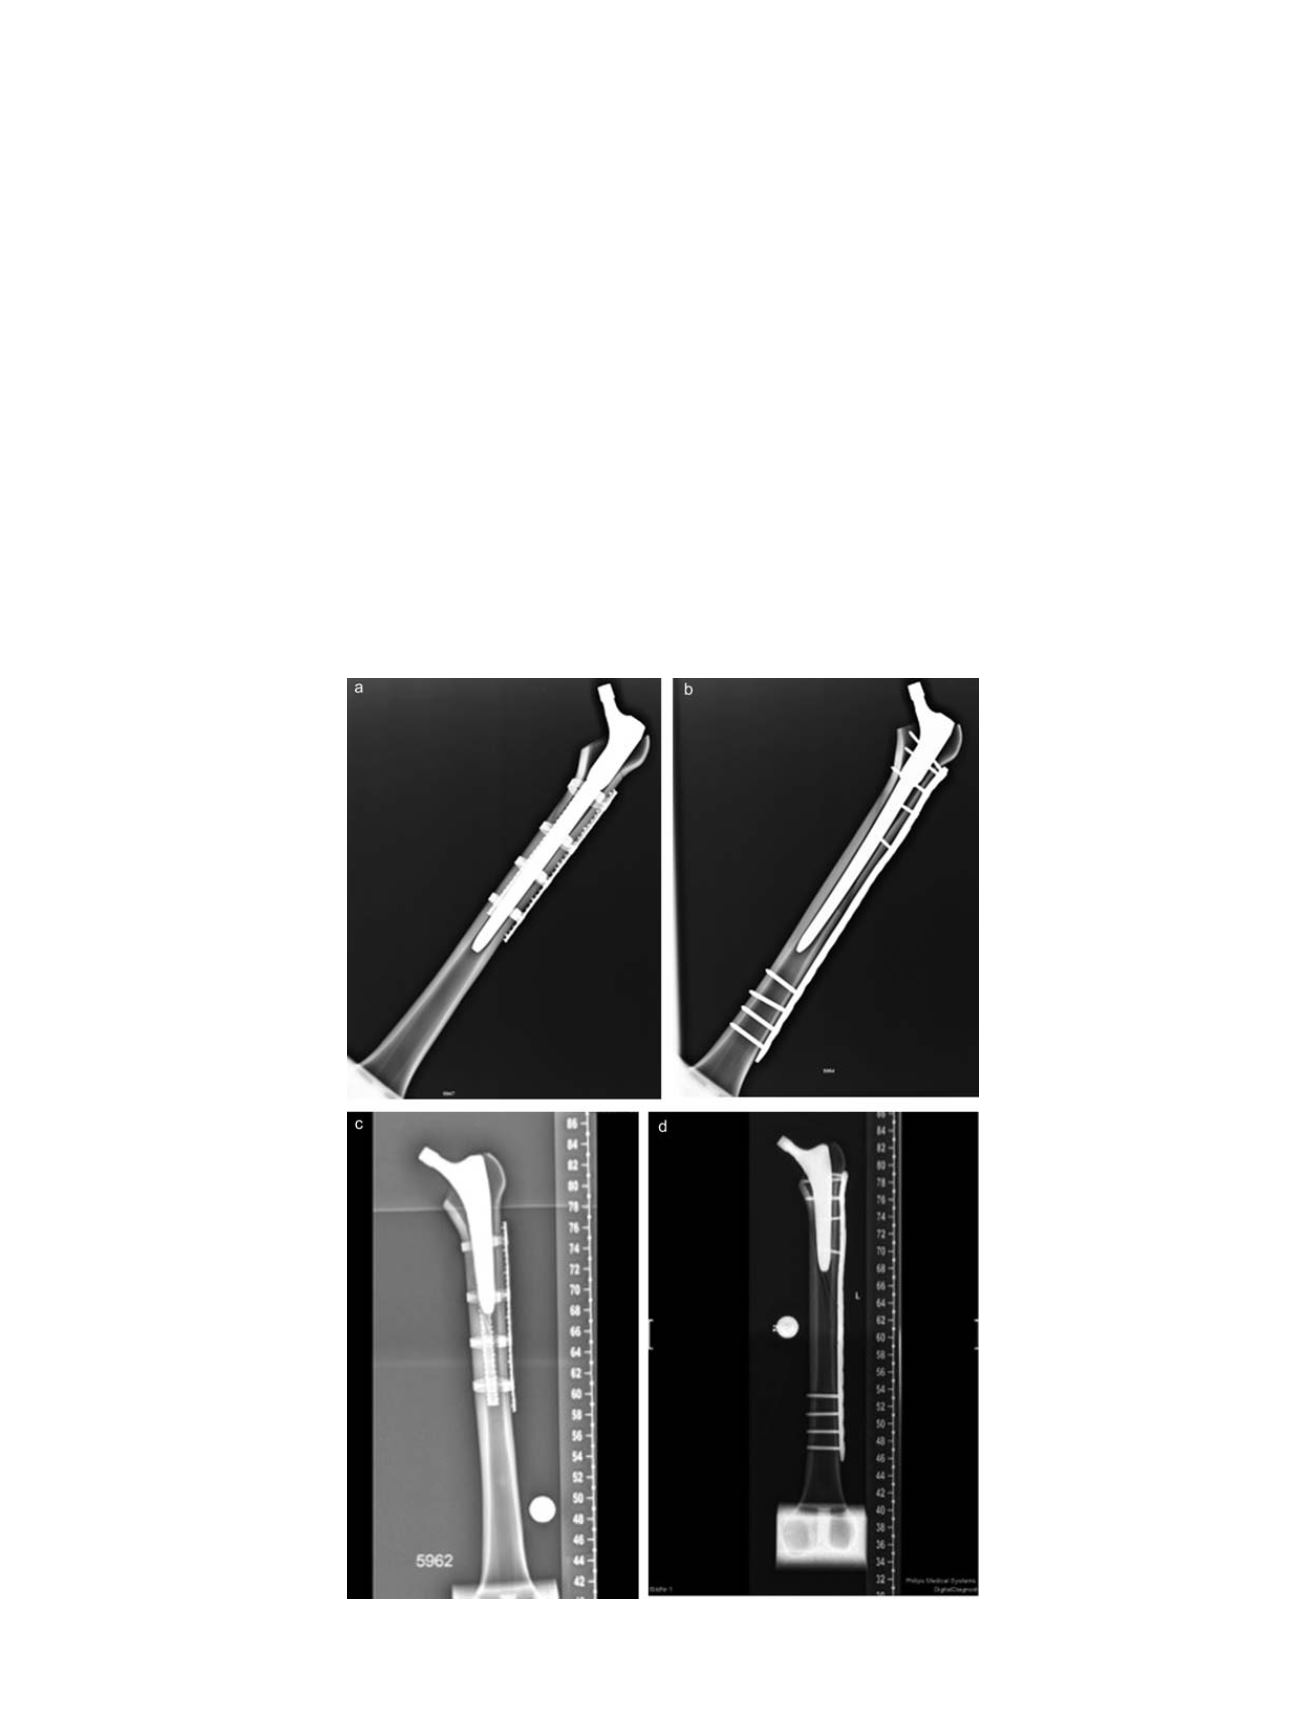
Fig. 3.
(a) X-ray long revision stem/cerclage. (b) X-ray long revision stem/plate. (c) X-ray short primary stem/cerclage. (d) X-ray short primary stem/plate.
K. Gordon et al. / Injury, Int. J. Care Injured 47S2 (2016) S51
–
S57
S53